I. Motivation (By Dustin Pease)
There exists a broad spectrum of potential skills that a pitcher may have. Depending on which skills a pitcher excels at, he may be classified into one of several types of pitchers. Two overarching buckets of pitchers are Finesse and Power. Based on years of my experience I have developed two hypotheses: pitchers labeled as finesse or considered having a higher level of command than others have been able to produce a higher called strike percentage and a higher proportion of strikeouts looking. I believe that these results are based on two assertions. First, Finesse pitchers are able to command the border of the strike zone where batters are less inclined to swing. Second, Finesse pitchers can expand the strike zone by consistently “nibbling” or pitching close enough to the corner of the zone that umpires feel obliged to award strikes. If the hypotheses are validated, it will lend evidence that Finesse/Command pitchers may have a certain pitch called a strike, but the exact same pitch from another pitcher may not be called a strike. Also, such a finding would provide support for the strategy of commanding in and out of the strike zone.
If you are a pitcher, coach, or evaluator, what can you take away from this if the hypotheses are validated? The essential factors here are based on relevant velocities, a pitcher who may have a higher ability to hit their targets more precisely and strategically (aka borders of strike zone), will have a chance to have more pitches called strikes in their favor. This greatly adds value to pitchers that have great fastballs, as well as pitchers who do not have great fastballs. Consistent location, establishment / “nibbling”, can produce more favorable counts over time. Because a “commander” may fall behind in the count, doesn’t mean they don’t have command. Strategically establishing zone borders in some cases takes time, and any pitcher who remains committed to the strategy may produce higher numbers of called strikes and strikeouts looking.
What does this mean? We get so excited to see people swing and miss (whiff rate), and while this is important avoid hard contact, not enticing a swing at all is just as good (“nibble rate”). A strike is a strike. Borderline pitches won’t invoke as many swings or great swings, and if they do many times they are defensive in nature.
An important piece here to consider is things such as velocity, deception, and movement are all components that do NOT affect a pitcher’s ability get a higher called strike %. LOCATION is the KEY component in order to achieve this which is why we have focused on zone borders and which pitches are executing there compared to not. We may keenly see why velocity, deception, and movement will all coax more swings when located over fat parts of the plate, resulting in less takes.
Study by:
Brad Woodfield
NCAA I Pitcher, Lafayette College
University of Chicago MBA `18
II. Player/Industry Takeaways
A. What can players/coaches/ evaluators do differently?
B. Summary of analysis results.
III. Hypothesis
A. What are we testing?
B. What led me to believe that might be true?
IV. Data
To test these hypotheses, we analyzed MLB’s Statcast data for the 2017 season. This dataset has detailed pitch-by-pitch information for every MLB game. The data has statistics about individual pitchers which we can use to classify pitchers into different types (e.g., Power vs Finesse). The data also logs outcomes of individual pitches and plate appearances. We limited the scope of our analysis to starting pitchers who pitched at least 170 innings. The scope is narrowed to make the analysis more manageable, plots more readable, and because we believe there are measurable differences between a power starting pitcher and a power relief pitcher (i.e., 95mph out of the bullpen is different than 95mph from a starter). We feel that the Statcast data is sufficient to evaluate our hypotheses and our scope is broad enough to generalize any findings.
A. Methodology
We used a two-step approach to evaluating the hypotheses. The first step is defining pitcher types and classifying which pitchers belong to which type. The second step is summarizing statistics for each pitcher type.
Defining groups and classifying observations into said groups falls into a branch of Machine Learning called unsupervised learning. We employed K-Means cluster analysis to accomplish this task. The K-Means algorithm is a commonly used approach to such a problem. The algorithm seeks to define a prescribed number clusters or groups that are as homogeneous as possible across a set of attributes. The attributes that we think define pitcher type are as follows:
Average fastball velocity
Percentage of pitches that are fastballs
How often the pitcher is in a disadvantaged count (3-0, 3-1, 2-0)
Fastball whiff rate
Off-speed whiff rate
Percentage of “nibble” pitches (pitches close to the corner of the strike zone)
Primary off-speed pitch type
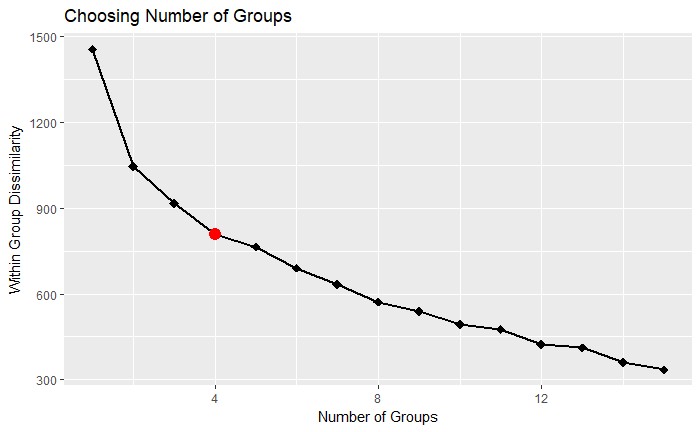
We took a data-driven approach to determining how many groups made the most sense. For each number of groups, we calculated and plotted the within group sum of squares (a measurement of dissimilarity). As more groups are created, within group sum of squares decreases at a decreasing marginal rate. In generic cluster analysis one would choose the number of groups “at the elbow” of the chart, that is the before marginal decreases significantly diminish. In addition to looking at the elbow, we use some a priori intuition of how different pitchers pitch. After defining groups, we look at summary statistics and plots to determine labels for the groups (i.e., which group is the power pitcher group?).
Once the groups have been defined and labeled we can aggregate player statistics for the group. We will be able to empirically evaluate the hypotheses above.
V. Analysis Results
A. Cluster Plots
The chart below is instructive for choosing how many groups to classify pitchers into. There is no clear “elbow” in the plot. A case for 2 or 4 groups could be made. We used our intuition and experience to decide that there are more than 2 types of pitchers and 4 seemed more aligned with what we have observed.
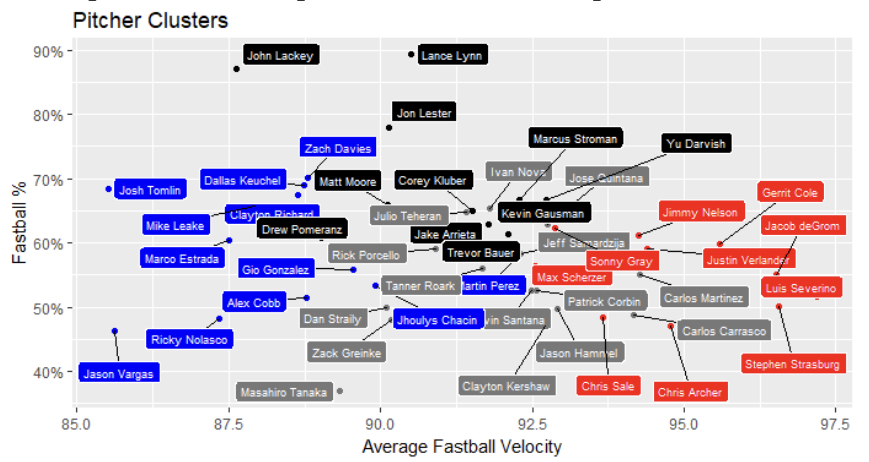
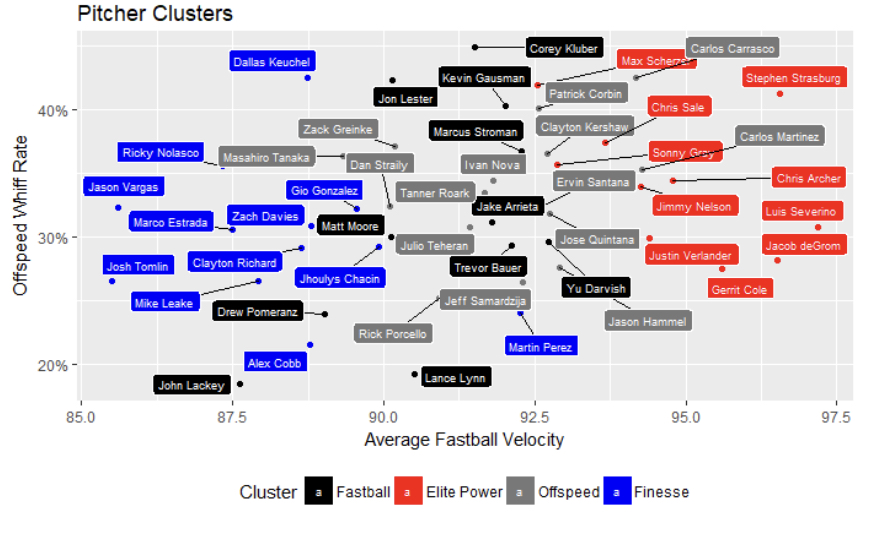
The following plots show pitchers’ summary statistics that were fed into the K-Means algorithm. The different colors signify different clusters as identified by the algorithm.
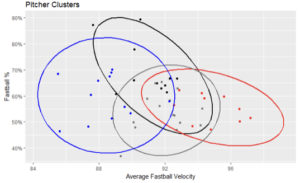
We see in the large plot that there are some pitchers who do not throw hard (blue), some that throw hard (red), then many that are in the middle. Some of those middle pitchers throw many fastballs (black) and some throw fewer (grey).
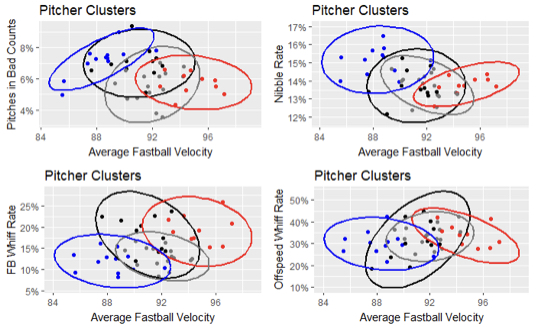
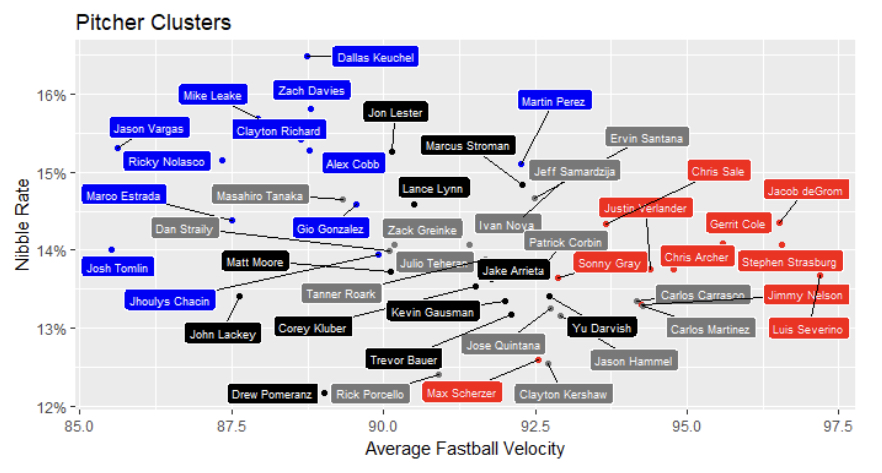
In the smaller charts we see many insights. I will describe a few of the important ones. The red group tends to not nibble on the corners of the strike zone as much as the blue group. The red and black group have higher fastball whiff rates which makes sense. The red group throws the hardest and the black group uses their fastball a lot. Off-speed whiff rates do not appear to vary much between groups.
We determined labels for each group by looking at the plotted location across the various pitcher attributes. We decided on the following labels: “Elite Power” (red), “Finesse” (blue), “Fastball” (black), and “Offspeed” (grey). We reproduced the above plots with each point labeled with the pitcher’s name.
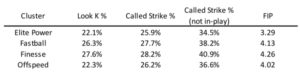
B. Summary Statistics
C. Hypothesis Evaluation
We can see from the summary statistics that our two hypotheses have been validated.
1. Finesse pitchers have a higher proportion of looking strikeouts than that of power pitchers.
2. Finesse pitchers have a higher proportion of called strikes than that of power pitchers.
IV. Extensions
A. Overvalued/Undervalued players
This type of analysis can be used for player valuation. An analyst can use this approach to identify players who are coming off seasons in which their performance is not indicative of what you might expect in future seasons.
Gio Gonzalez: Gonzalez had a strong 2017 season in which he racked up 15 wins and posted a 2.96 ERA over 201 innings. We have classified him as a Finesse pitcher, a category with few star performers. Stars from this group tend to have some attribute which separates them from the crowd (e.g., Dallas Keuchel’s high nibble rate and high off-speed whiff rate). Gonzalez does not have any positive attributes that may indicate strong future performances. Whiff rates are relatively low for fastballs and off-speed pitches. Gonzalez throws a lot of pitches in disadvantaged counts despite not having a high nibble rate. This means that he is often behind in the count, but not because he is just missing the corner. Based on this, we would not expect Gonzalez to have a strong 2018 season. This analysis aligns with what advanced metrics indicate about his 2017 season, he was more lucky than good. (high FIP/ERA, low BABIP, high LOB%)
Kevin Gausman: Gausman took a step backwards in a disappointing 2017 season in which he had a sub .500 record and posted a 4.68 ERA in 186 innings. We have classified him as Fastball pitcher, a group with several strong pitchers and some perennial All-Stars. With our analysis it is hard to diagnose exactly what went wrong for Gausman last year. He is around the centroid of his group in most of the plots. We expect he will have a better season next year and perhaps perform as well as some of the other pitchers in his group. Once again, this is consistent with some of the advanced metrics for Gausman. (high BABIP, somewhat low LOB%)
B. Pitch selection
This analysis can be used to inform pitch selection. Looking at relative whiff rates and comparing nibble rates to disadvantaged count rates we would recommend that some pitchers change their mix of pitches. Some pitchers should throw more or fewer off-speed pitches. Some pitchers should try to increase their nibble rate at the expense of perhaps pitching more in disadvantaged counts.
Marcus Stroman: Stroman throws a lot of fastballs but does not have a high fastball whiff rate. His off-speed whiff rate quite high, close to that of Clayton Kershaw and Chris Sale. We would recommend that he feature more of his off-speed pitches with which batters have a tough time making contact. Stroman does pitch in a lot of disadvantaged counts, which may explain his high fastball usage.
Jeff Samardzija: Nobody throws fewer pitches in disadvantaged counts than Samardzija, except Clayton Kershaw. Samardzija has a fairly high nibble rate considering he’s rarely behind in the count. He does not have very high whiff rates. We would recommend that he nibbles even more than he does now in an attempt to increase his whiff rates.