Optimal Pitcher Response to Baseball’s Power Surge:
A Data-Driven Approach from Major League Baseball
Brad Woodfield
NCAA I Pitcher, Lafayette College
University of Chicago MBA `18
There is overwhelming evidence of increasing importance of the home run in Major League Baseball. Teams’ offenses are more leveraged on the home run today than offenses in the past. The League-wide Guillen Number for 2017 was 40%, the highest in over 20 years, and the League-wide Home Run per Game rate was 1.26, an all-time record high. Additionally, individual players are tailoring their swing to create lift in a quest for more power (Justin Turner and Daniel Murphy amongst many others).
In response to this changing offensive dynamic, successful pitchers will need to implement strategies to either avoid home runs and/or minimize the impact of home runs. This post will focus on the strategy of avoiding home runs, specifically off fastballs. I used MLB’s PitchFX data on fastballs from the 2016 season1 to create a probabilistic model of home runs2 with input variables of pitch location, pitch velocity, balls-strikes count, and a measure of the batter’s power. The model isolates the impact of each input variable on the probability of a home run being surrendered on that pitch.
Pitcher Take-Aways
Unsurprisingly, pitch location has a large impact on the likelihood of a fastball being hit for a home run. Pitching down in the zone is more favorable than up in the zone. The difference between a fastball at the belt versus a fastball at the knees is equivalent to the difference between a 90 MPH fastball and a 100 MPH fastball.
Command of the fastball is an integral part of a pitcher’s strategy to avoid home runs and minimize the impact of home runs. Pitching to the corners of the strike zone has a similar impact on home run likelihood as adding 10 MPH to a fastball. Locating a fastball is something for which pitchers can train while large improvements in fastball velocity are rare at any level. To avoid home runs pitchers should learn and practice sound, consistent mechanics which improve pitch accuracy rather than focus on velocity.
Analysis
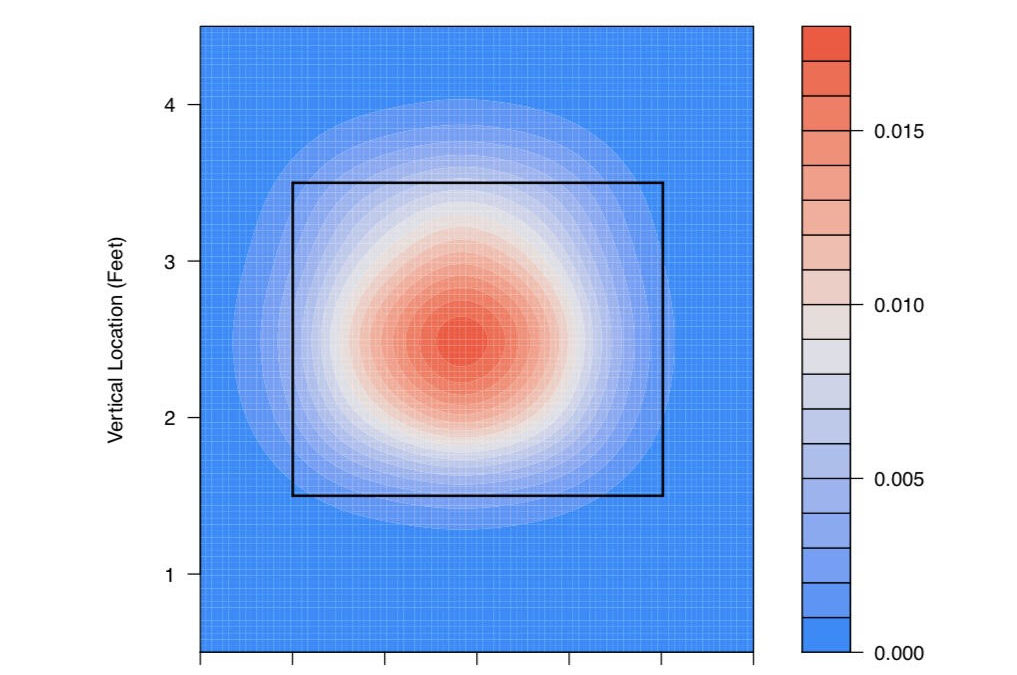
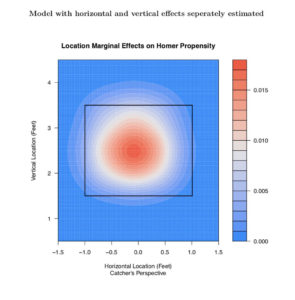
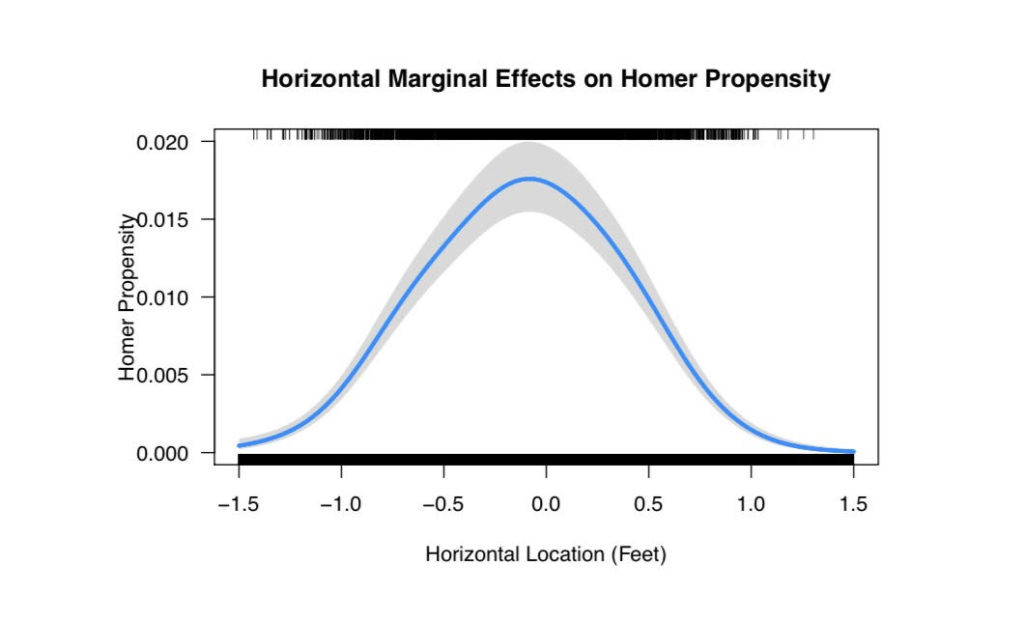
The heat map below shows the area around the strike zone from the catcher’s perspective with an average MLB strike zone outlined in black. The colored contours relate to the legend on the right-hand side and display the model’s estimated marginal effects on home run probability, holding all other inputs constant (velocity, count, batter’s power). For example, a pitch of average velocity to an average hitter in a 0-0 count that is located down the middle will be about 1.7 percentage points more likely to be hit for a home run than a pitch on the corner of the strike zone. The impact of a pitch being located down the middle versus on the corner is enormous considering that only 0.8% of pitches in the data were hit for home runs. The probability of an average pitch well located being hit for a home run could be 0.8%, but if that same pitch was poorly located the probability of a home run would balloon to 2.5%.
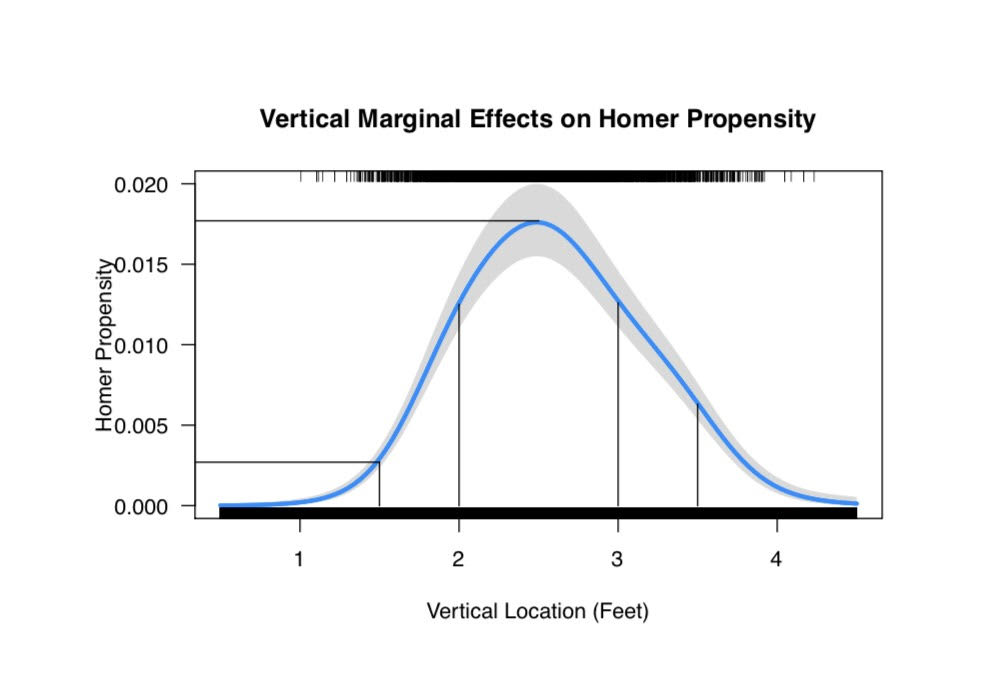
To focus on the impact of a fastball’s vertical location (at the knees, belt, or letters), I have created the line graph below. The horizontal axis is the pitch height in feet when it crossed home plate. The strike zone is generally between 1.5 and 3.5 feet off the ground. The vertical axis is the marginal change in the pitch’s probability of getting hit for a home run, holding all other inputs constant. The interpretation is similar to the heat map, but only for the height of the pitch. The steeper slope of the blue line in the bottom 6 inches of the strike zone compared to the blue line’s top 6 inches of the strike zone indicate that fastballs in the bottom of the zone are less likely to be hit for a home run than fastballs at the top of the zone. The difference between the most favorable location (that is still a strike) and the least favorable location for a fastball is worth 1.5 percentage points in home run probability.
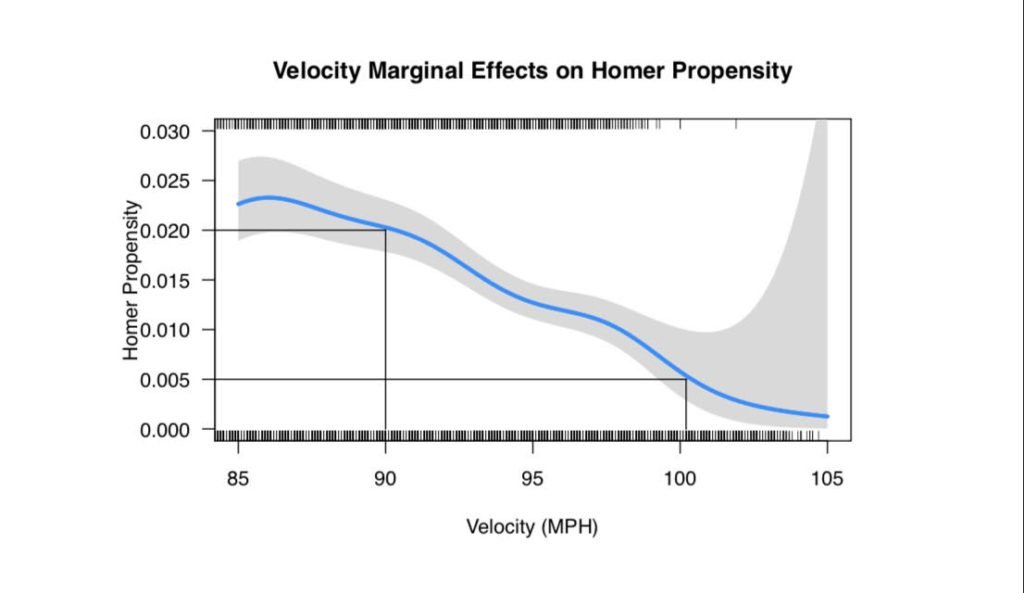
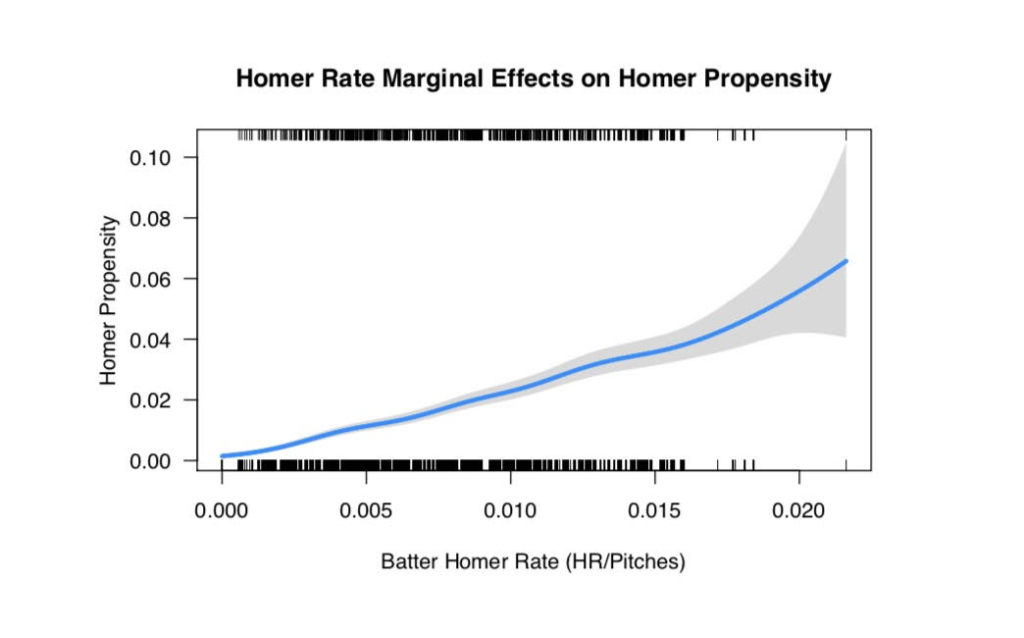
To understand the trade-off between fastball command and fastball velocity, I calculated the necessary increase to velocity that would have an equivalent impact to home run probability as improved command. The 1.5 percentage point decrease in home run probability resulting from improved command found above was translated to the graph below. The graph below is similar to the graph above, with the exception of velocity on the horizontal axis. The 1.5 percentage point decrease in home run probability translates to a 10 MPH increase to a 90 MPH fastball. 90 MPH is roughly the velocity of an average Major League fastball while 100 MPH is an elite fastball with few pitchers able to throw that hard.
Notes
1. PitchFX data has been filtered to only include MLB regulars (100+ Plate Appearances and 100+
Pitches) and only includes pitches near the strike zone.
2. The model’s form is a Binary Logistic Generalized Additive Model. This model type estimates the
probability of a binary outcome and allows for non-linear effects from the input variables.
log ቆ
P(Home Run)
1 − P(Home Run)
ቇ = fଵ(Horizontal Location) + fଶ(Vertical Location) + fଷ(Velocity) + fସ(Batter HR Rate) + βଵ(Count) + ε
About the Guest Blogger:
Brad Woodfield possesses his BA from Lafayette University (NCAA I), double majoring in fields of Math and Econ. En route to his MBA ’18 with concentration of Econometrics from the University of Chicago. Brad has teamed up with Lokation Nation on the data and analytics side, to provide more studies and information for the baseball community to view and fairly determine results of pitching command and location, in relation or accordance with velocity. We will be utilizing a variety of topics and theories to help us better understand how command and location may be a bit underrated in terms of what makes pitchers truly successful. Brad brings unique perspective to his ability to number crunch being that he was a Division I pitcher for Lafayette University in the Patriot League (NCAA I). Welcome aboard!